SVG Vector Graphics in Python
Here's a quick example of how to generate vector graphics using python and the svgwrite package. This can be handy if you need to diagram something structured and repetetive, and it's easier to describe in code than to draw by hand.
SVG is a simple, human readable (xml) format too, and it can be embedded right into HTML documents with the <svg> tag. SVG elements -- paths, rectangles, lines, etc. -- support HTML semantics for element selection and styling. You can give each element an id or a class, and then use these to selectively change the color, visibility, thickness, etc of individual elements in your graphic. This means that with a little javascript your diagrams can become interactive.
You can also combine python generated SVG elements with hand-drawn. I was able to simple open the python generated file in inkscape, and add some features manually. These features can then be relatively easily copied from the SVG file -- its just XML after all -- and saved separately so that it can be automatically injected into the python generated file in case you need to edit the python and regenerate. Because its human readable, it's super flexible to work with.
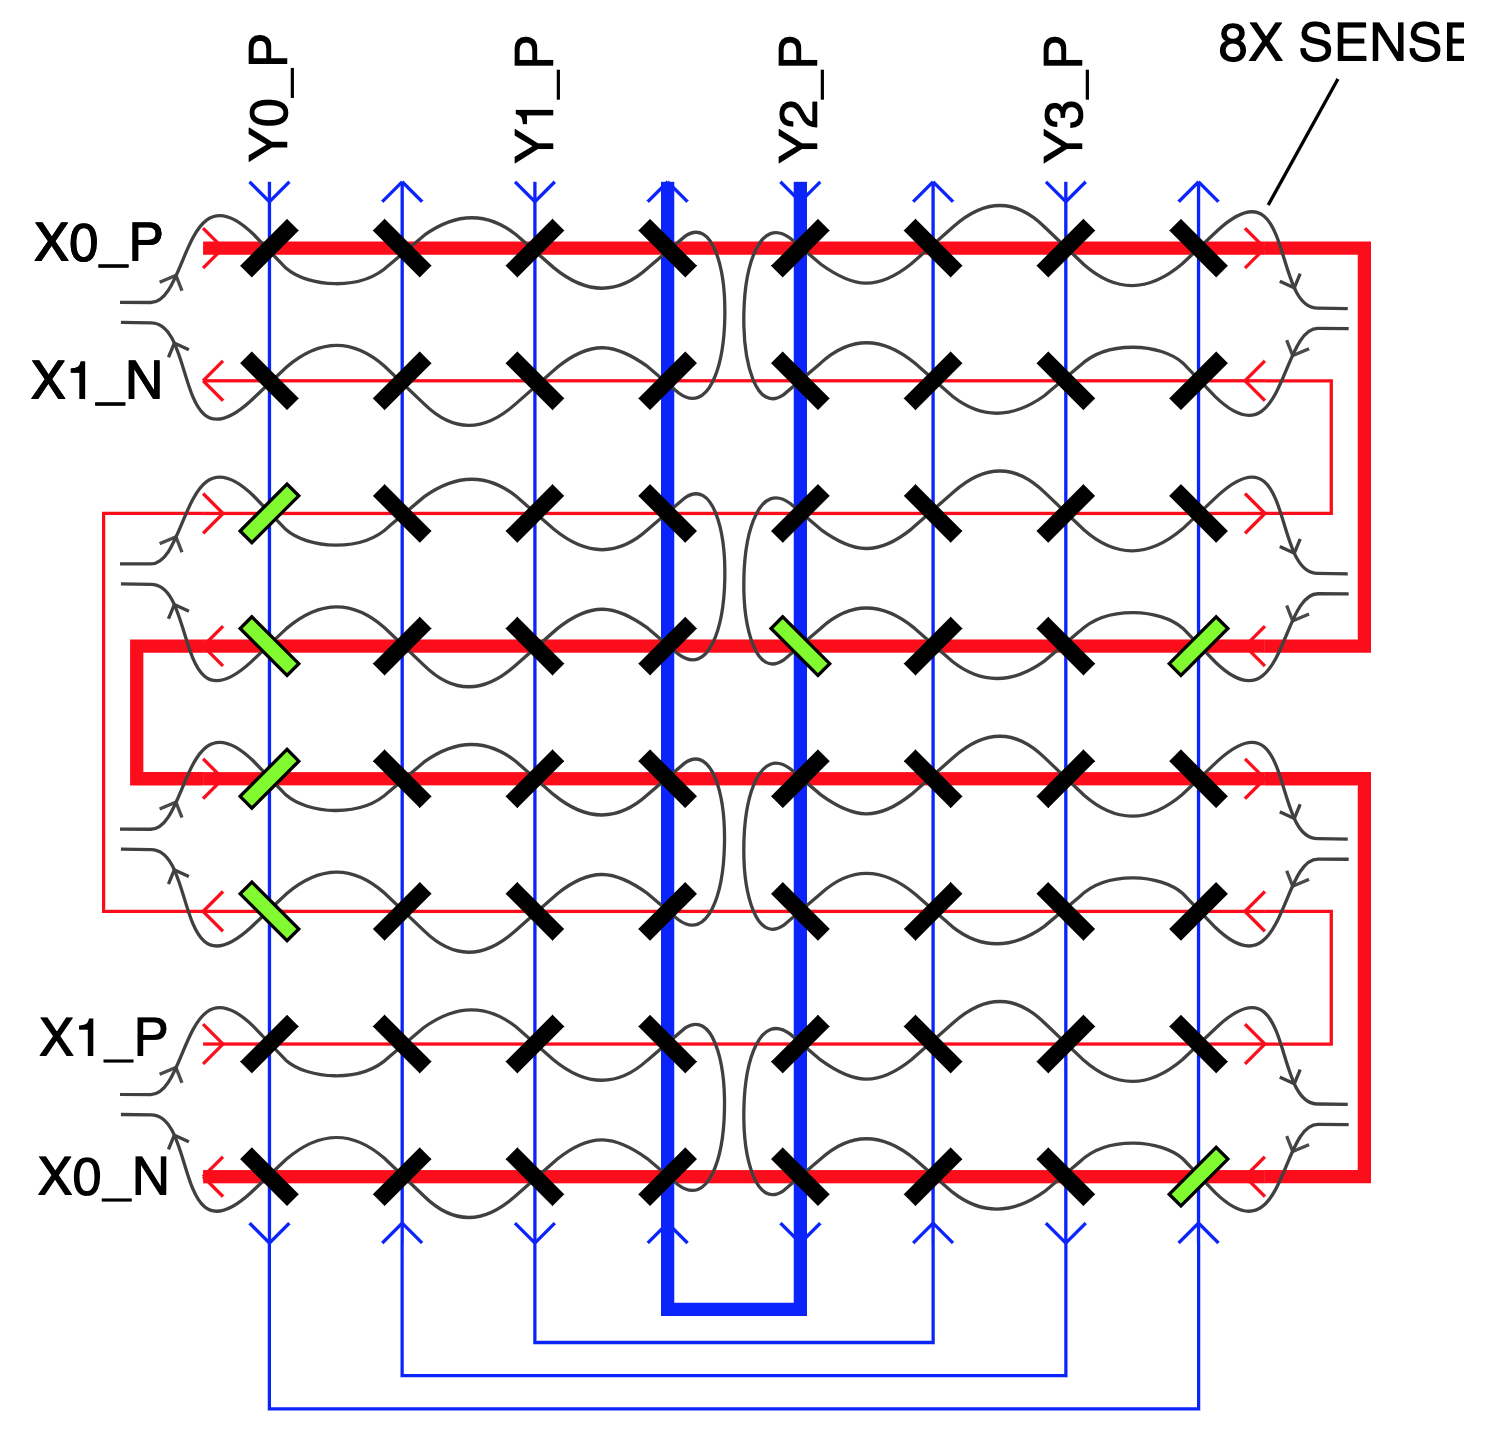
I used the python code below to generate this diagram, which was then embedded into a javascript application to control a 64-bit core memory array. If we peek into the SVG a bit, we can find this:
<g class="DriveWires">
    <line id="X0" stroke="red" x1="100" x2="420" y1="120.0" y2="120.0"/>
    <line id="X1" stroke="red" x1="100" x2="420" y1="160.0" y2="160.0"/>
    <line id="X1" stroke="red" x1="100" x2="420" y1="200.0" y2="200.0"/>
    ... <snip>
</g>
<g class="Cores">
      <polygon id="core_00" points="111.16116523516816,125.3033008588991 114.6966991411009,128.83883476483186 128.83883476483186,114.6966991411009 125.3033008588991,111.16116523516816"/>
      <polygon id="core_01" points="154.6966991411009,111.16116523516816 151.16116523516814,114.6966991411009 165.3033008588991,128.83883476483186 168.83883476483186,125.3033008588991"/>
      <polygon id="core_02" points="191.16116523516814,125.3033008588991 194.6966991411009,128.83883476483186 208.83883476483186,114.6966991411009 205.3033008588991,111.16116523516816"/>
      ... <snip>
</g>
So there is a g tag with a class, grouping all of the lines that make up the drive wires, and all the polygons that make up the "cores". I wanted to highlight certain subsets of these, so I added a bit of CSS:
g.Cores .active {
    stroke: black;
    fill: lawngreen;
}

g.DriveWires .active {
    stroke-width: 4;
}
Now, any of the cores that gets the class "active" assigned to it will be green, and any of the wires that are marked with the "active" class will be bold. Then I used the id values as selectors to set the class in code.
Here's the control GUI where this SVG is used as an interactive memory state display: https://github.com/mcbridejc/core-mem-dashboard
Here's the full svg generation script:
import math
import svgwrite
from svgwrite import cm

def ferrite_rect(cx, cy, righthanded, element_id):
    w = 20
    h = 5
    if righthanded:
        theta = 45 * math.pi / 180.
    else:
        theta = -45 * math.pi / 180.

    def rotate(p, theta):
        c = math.cos(theta)
        s = math.sin(theta)
        return (
            c * p[0] + s * p[1],
            -1 * s * p[0] + c * p[1]
        )

    pts = [
        rotate((-w/2, -h/2), theta),
        rotate((-w/2, h/2), theta),
        rotate((w/2, h/2), theta),
        rotate((w/2, -h/2), theta),
    ]
    pts = [(p[0] + cx, p[1] + cy) for p in pts]
    return svgwrite.shapes.Polygon(pts, id=element_id)

    NCOL = 8
NROW = 8
MARGIN = 100
PITCH = 40
image_height = NROW * PITCH + 2 * MARGIN
image_width = NCOL * PITCH + 2 * MARGIN

XDRIVE_COLOR = "red"
YDRIVE_COLOR = "blue"
SENSE_COLOR="gray"

def connect_cols(dwg, r1, r2, depth, topside, element_id):
    WIRE_PITCH = 10 # space between stacked parallel connecting wires
    if topside:
        ystart = MARGIN
    else:
        ystart = image_height - MARGIN

    path = []
    def append_point(p):
        if len(path) == 0:
            path.append("M %f %f" % (p[0], p[1]))
        else:
            path.append("L %f %f" % (p[0], p[1]))

    x1 = MARGIN + r1 * PITCH + PITCH/2
    x2 = MARGIN + r2 * PITCH + PITCH/2
    append_point((x1, ystart))
    append_point((x1, ystart + (depth+1) * WIRE_PITCH))
    append_point((x2, ystart + (depth+1) * WIRE_PITCH))
    append_point((x2, ystart))
    dwg.add(svgwrite.path.Path(path, fill="none", stroke=YDRIVE_COLOR, id=element_id))

def connect_rows(dwg, r1, r2, depth, leftside, element_id):
    WIRE_PITCH = 10 # space between stacked parallel connecting wires
    if leftside:
        xstart = MARGIN
        xdelta = -WIRE_PITCH * (depth + 1)
    else:
        xstart = image_height - MARGIN
        xdelta = WIRE_PITCH * (depth + 1)

    path = []
    def append_point(p):
        if len(path) == 0:
            path.append("M %f %f" % (p[0], p[1]))
        else:
            path.append("L %f %f" % (p[0], p[1]))

    y1 = MARGIN + r1 * PITCH + PITCH/2
    y2 = MARGIN + r2 * PITCH + PITCH/2
    append_point((xstart, y1))
    append_point((xstart + xdelta, y1))
    append_point((xstart + xdelta, y2))
    append_point((xstart, y2))
    dwg.add(svgwrite.path.Path(path, fill="none", stroke=XDRIVE_COLOR, id=element_id))

def set_row_direction(dwg, row, right):
    arrow_points = [
        (MARGIN + 3, MARGIN + row * PITCH + PITCH/2),
        (image_width - MARGIN - 3, MARGIN + row * PITCH + PITCH/2),
    ]
    for p in arrow_points:
        if right:
            dwg.add(svgwrite.shapes.Line(start=(p[0] + 3, p[1]), end=(p[0] - 3, p[1] - 6), stroke=XDRIVE_COLOR))
            dwg.add(svgwrite.shapes.Line(start=(p[0] + 3, p[1]), end=(p[0] - 3, p[1] + 6), stroke=XDRIVE_COLOR))
        else:
            dwg.add(svgwrite.shapes.Line(start=(p[0] - 3, p[1]), end=(p[0] + 3, p[1] - 6), stroke=XDRIVE_COLOR))
            dwg.add(svgwrite.shapes.Line(start=(p[0] - 3, p[1]), end=(p[0] + 3, p[1] + 6), stroke=XDRIVE_COLOR))

def set_col_direction(dwg, col, down):
    arrow_points = [
        (MARGIN + col * PITCH + PITCH/2, MARGIN + 3),
        (MARGIN + col * PITCH + PITCH/2, image_width - MARGIN - 3),
    ]
    for p in arrow_points:
        if down:
            dwg.add(svgwrite.shapes.Line(start=(p[0], p[1] + 3), end=(p[0] - 6, p[1] - 3), stroke=YDRIVE_COLOR))
            dwg.add(svgwrite.shapes.Line(start=(p[0], p[1] + 3), end=(p[0] + 6, p[1] - 3), stroke=YDRIVE_COLOR))
        else:
            dwg.add(svgwrite.shapes.Line(start=(p[0], p[1] - 3), end=(p[0] - 6, p[1] + 3), stroke=YDRIVE_COLOR))
            dwg.add(svgwrite.shapes.Line(start=(p[0], p[1] - 3), end=(p[0] + 6, p[1] + 3), stroke=YDRIVE_COLOR))

drawing = svgwrite.Drawing(size=(image_width, image_height))

# Order in which groups are added defines the order they are drawn in
drive_group = drawing.add(drawing.g(class_="DriveWires"))
sense_group = drawing.add(drawing.g(class_="SenseWies"))
core_group = drawing.add(drawing.g(class_="Cores"))

# Draw the ferrite torroids
right_handed = False
for row in range(0, NROW):
    right_handed = ~right_handed # Each row has opposite direction polarity from its neighbors
    for col in range(0, NCOL):
        cx = MARGIN + col * PITCH + PITCH/2
        cy = MARGIN + row * PITCH + PITCH/2
        element_id = "core_%d%d" % (row, col)
        core_group.add(ferrite_rect(cx, cy, right_handed, element_id))
        right_handed = ~right_handed

# Table of IDs for x/y drive wires. These labels are applied to the elements, e.g. to allow
# adjusting their style via CSS later
XLABELS = [
    "X0",
    "X1",
    "X1",
    "X0",
    "X0",
    "X1",
    "X1",
    "X0",
]
YLABELS = [
    "Y0",
    "Y3",
    "Y1",
    "Y2",
    "Y2",
    "Y1",
    "Y3",
    "Y0",
]

# Draw the X/Y drive wires through the torroids
for row in range(0, NROW):
    y = MARGIN + PITCH/2 + row * PITCH
    drive_group.add(
        svgwrite.shapes.Line(
            start=(MARGIN, y),
            end=(image_height-MARGIN, y),
            stroke=XDRIVE_COLOR,
            id=XLABELS[row]))
for col in range(0, NCOL):
    x = MARGIN + PITCH/2 + col * PITCH
    drive_group.add(
        svgwrite.shapes.Line(
            start=(x, MARGIN),
            end=(x, image_width-MARGIN),
            stroke=YDRIVE_COLOR,
            id=YLABELS[col]))

# Draw connections between the drive wires on the edges
connect_cols(drive_group, 0, 7, 4, False, YLABELS[0]);
connect_cols(drive_group, 1, 6, 3, False, YLABELS[1]);
connect_cols(drive_group, 2, 5, 2, False, YLABELS[2]);
connect_cols(drive_group, 3, 4, 1, False, YLABELS[3]);

connect_rows(drive_group, 0, 3, 2, False, XLABELS[0]);
connect_rows(drive_group, 1, 2, 1, False, XLABELS[1]);
connect_rows(drive_group, 2, 5, 2, True, XLABELS[2]);
connect_rows(drive_group, 3, 4, 1, True, XLABELS[3]);
connect_rows(drive_group, 4, 7, 2, False, XLABELS[4]);
connect_rows(drive_group, 5, 6, 1, False, XLABELS[5]);

# Mark the polarity of each row/column drive wire
row_directions = [True, False, True, False, True, False, True, False]
for i, d in enumerate(row_directions):
    set_row_direction(drive_group, i, d)

col_directions = [True, False, True, False, True, False, True, False]
for i, d in enumerate(col_directions):
    set_col_direction(drive_group, i, d)

drawing.save('diagram.svg')